
Your CRM is full. Every deal has a stage, an amount and a close date. And you still walk into the forecast call knowing a few "commit" deals might blow up in week 12.
That's the problem with pipeline forecasting built only on CRM data. CRM data records what your reps believe about each deal. It can’t show you what the buying group is doing.
This guide adds that missing evidence to your forecast review, with a seven-step check you can run in your next weekly call.
What is pipeline forecasting?
Pipeline forecasting is the process of estimating how much revenue your open deals will turn into, and by when.
It's built for sales leaders, RevOps and frontline managers who need a number they can defend in a forecast call or board meeting. Most teams build it from CRM stage, amount and close date.
It's different from a sales forecast. A sales forecast projects total revenue, often using history, seasonality and run rate. A pipeline forecast starts from the specific open deals in front of you and asks which ones will close, and when.
How traditional pipeline forecasting works
Quick answer: Weighted pipeline forecasting multiplies each deal’s value by its stage probability and adds up the results. It only holds across a portfolio. A single $1 million deal at 20% won’t produce $200,000. It either closes or it doesn’t.
Traditional pipeline forecasting multiplies the value of open deals by the odds they'll close, then adds it all up. Sales managers, RevOps and CROs use it to predict revenue for a quarter or year. It's a sound baseline, but every input comes from what sellers enter in the CRM.
The core mechanics
Most teams build a pipeline forecast in four moves:
-
Assign a probability to each stage. A deal in discovery might carry 10%. A deal in negotiation might carry 60%.
-
Multiply by deal value. A $50,000 deal at 60% adds $30,000 to the weighted pipeline.
-
Sum the results. That total is your expected revenue.
-
Check the timing. Close date, average sales cycle length and sales velocity decide which quarter the revenue lands in.
Win rate and average deal size sharpen the math. Then reps and managers sort deals into commit, best case and upside. Definitions vary by company, so Gartner recommends mapping each category to verifiable deal progress, not rep confidence.
One caution: weighting only works across a portfolio. A single $1 million deal at 20% won't produce $200,000. It either closes or it doesn't.
Where it holds up and where it leans
|
Input |
Source |
Weak spot |
|---|---|---|
|
Stage |
Rep-selected |
Stage inflation |
|
Amount |
Rep-entered |
Stale or optimistic |
|
Close date |
Rep-estimated |
Slips quietly |
|
Category |
Rep or manager call |
Confidence, not evidence |
Research backs the concern. Subjective seller ratings underperformed model-based assessment in a peer-reviewed study [AAAI, 2025].
None of this makes stage-based pipeline forecasting wrong - it just makes it dependent on what sellers report.
Why CRM data alone isn't enough for accurate pipeline forecasting
Buyers do most of their work where your CRM can't see it. McKinsey found decision-makers use an average of 10 interaction channels [McKinsey, 2024], and 61% of buyers prefer a rep-free experience [Gartner, 2025].
Here's what CRM fields can't show you:
-
Who's actually involved: buying groups average 13 people [Forrester, 2025], but your CRM may list one contact.
-
Whether buyers agree: 74% of buying groups show unhealthy conflict [Gartner, 2025].
-
Whether anything moved: a deal can sit in "Negotiation" for six weeks while nobody on the buyer side opens a thing.
Yes, CRM still holds the structure, history and process. But building a data-driven pipeline means adding a second source: observable, real-time buyer behavior, or buyer engagement.
What is buyer engagement data?
Buyer engagement data is the first-party record of what buyers do inside your own deal: who opened the proposal, which pages they read, who they shared it with and which tasks they finished.
Engagement data shows behavior. Whether that behavior signals intent is an inference, so this guide uses it to prompt questions in your forecast review, not to settle them.
Which buyer signals actually matter in a forecast review
Quick answer: Senior stakeholder engagement is always associated with wins. Check who engaged, how broadly and how recently before you look at a view count at all.
Volume alone tells you little. Treat each signal as a prompt for a question, not a verdict.
The signals to inspect first
Who engages matters more than how often.
Here's what to look for in a Digital Sales Room or any engagement source:
-
Senior stakeholder activity: Has an economic buyer or executive sponsor opened the room, or is it still your champion alone?
-
Breadth: Gartner associates consensus with a 2.5x higher likelihood of a high-quality deal. More roles engaging suggests the group is converging, not just one person forwarding links.
-
Recency: Activity three weeks ago doesn't support this quarter's close date.
-
Buyer-owned progress: Completed Mutual Action Plan tasks, proposal views by legal or finance and contract activity are buyer-verified. A rep saying \"it's going well\" is seller-reported.
What each signal can and can't tell you
|
Signal |
May indicate |
Doesn't prove |
|---|---|---|
|
New senior viewer |
Decision-maker is involved |
Approval |
|
Repeat views |
Active evaluation |
Interest (could be confusion) |
|
Internal sharing |
Wider buying group |
Consensus |
|
Silence |
Possible stall |
Disinterest |
Repeat views and long time spent on docs deserve extra caution. Individual-level relevance can hurt consensus, so repeated views may signal conflict [Gartner, 2025].
How to surface buyer engagement data in Digital Sales Rooms
Quick answer: Digital Sales Room's tracking and analytics logs what buyers do inside a deal: who entered, what each person read and downloaded, and whether action plan tasks and contracts are moving.
Digital Sales Rooms like GetAccept add the buyer-side evidence layer to pipeline forecasting. The deal room you create for each prospect tells you whether the buyer's behavior backs up your CRM data.
Start with the room's Analytics overview
Open a published Deal Room and click Analytics.
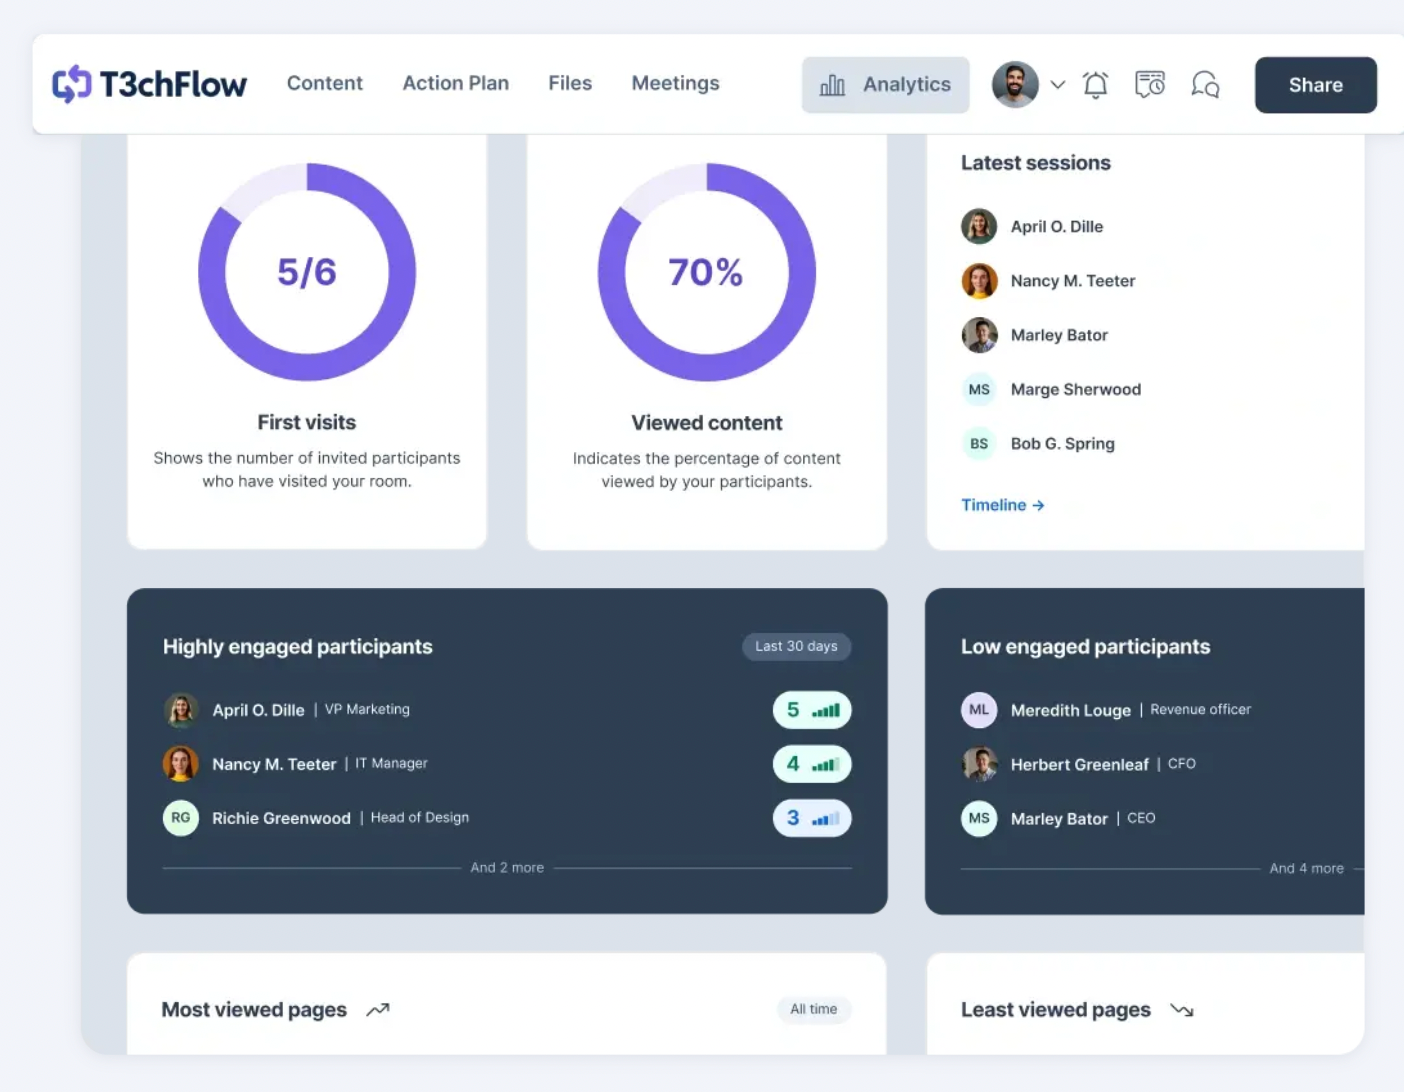 The Overview tab tells you whether the buying group is actually in the room. Four cards matter most for a forecast review:
-
First visits: invited participants who have entered the room at least once, shown as visitors out of invited. A commit deal at 2 of 7 is a multi-threading question for the rep.
-
Highly and low engaged participants: who's most and least active over the last 30 days, based on the Participant Engagement Score.
-
Least viewed pages: pages with little or no attention. An unopened pricing or security page late in a deal is a likely blocker.
-
Action plan summary: how much of the mutual action plan is complete (for example, 12 of 20 tasks), with a click-through to the full plan.
Use the Participant Engagement Score to find single-threaded deals
The Participant Engagement Score (PES) rates each participant from 0 to 5 based on their activity in the room over the last 30 days.

Read PES person by person. If the champion sits at 5 and the economic buyer at 0, the deal has interest without agreement. PES appears under Analytics > Participants and in the Rooms list overview, so you can check it across deals without opening every room.
Map buyer roles yourself, then read the scores against them. Treat a score as a prompt to look closer.
See what each stakeholder read and downloaded
The Content tab breaks engagement down by page and section: time spent, how many participants viewed it (for example, 2 of 5) and total visits.

Filter by participant to see exactly what your economic buyer read and what they skipped.
"They're reviewing it" becomes something you can verify through buyer analytics. If the security page has zero views two weeks before the close date, that's this week's question for the rep.
File analytics separates previews from downloads for each file and shows who did what, and when. If the champion downloads the pricing appendix and procurement downloads it the next morning, internal review may have started. Good moment to offer procurement a call on terms.
Read the Timeline when a deal goes quiet
The Timeline logs everything that happened in the room after it was published: visits, page views, chat and comments, action plan updates, file activity, contract events such as opened and signed, and meeting recordings viewed. Buyers can't see it.

Filter by participant, event type and date range, or export it as a CSV from Reports and use it to answer the recency question.
When a commit deal looks stalled, find the last real buyer action and its date. "Legal opened the contract on the 3rd and nothing has happened since" is a different forecast conversation from "no buyer has visited since kickoff."
Track buyer-owned progress in mutual action plan
The mutual action plan is where buyer-verified progress lives. Every milestone and task carries a status and can carry a due date.
Check those dates against the CRM close date. If the plan says legal review finishes on the 28th and the CRM says the deal closes on the 20th, one of them is wrong. Due dates don't sync to your CRM, so this is a manual check.
Scan the whole pipeline from the Rooms list
Nobody opens 40 rooms before Monday's call. The Rooms list gives you the pipeline-level view:
-
Participant activity: the latest action, who took it and when, for every room.
-
Contracts: linked contracts and their current status.
-
Lifecycle tabs: Active rooms separated from Idle rooms, which have had no activity for 90 days.
-
Overview: a snapshot of engagement insights and action plan progress without entering the room, plus a shortcut to the linked CRM record.
Pull engagement data into an AI assistant with the GetAccept MCP server
The GetAccept MCP server connects your GetAccept account to AI assistants, so you can ask about your deals in plain language instead of clicking through rooms one by one.
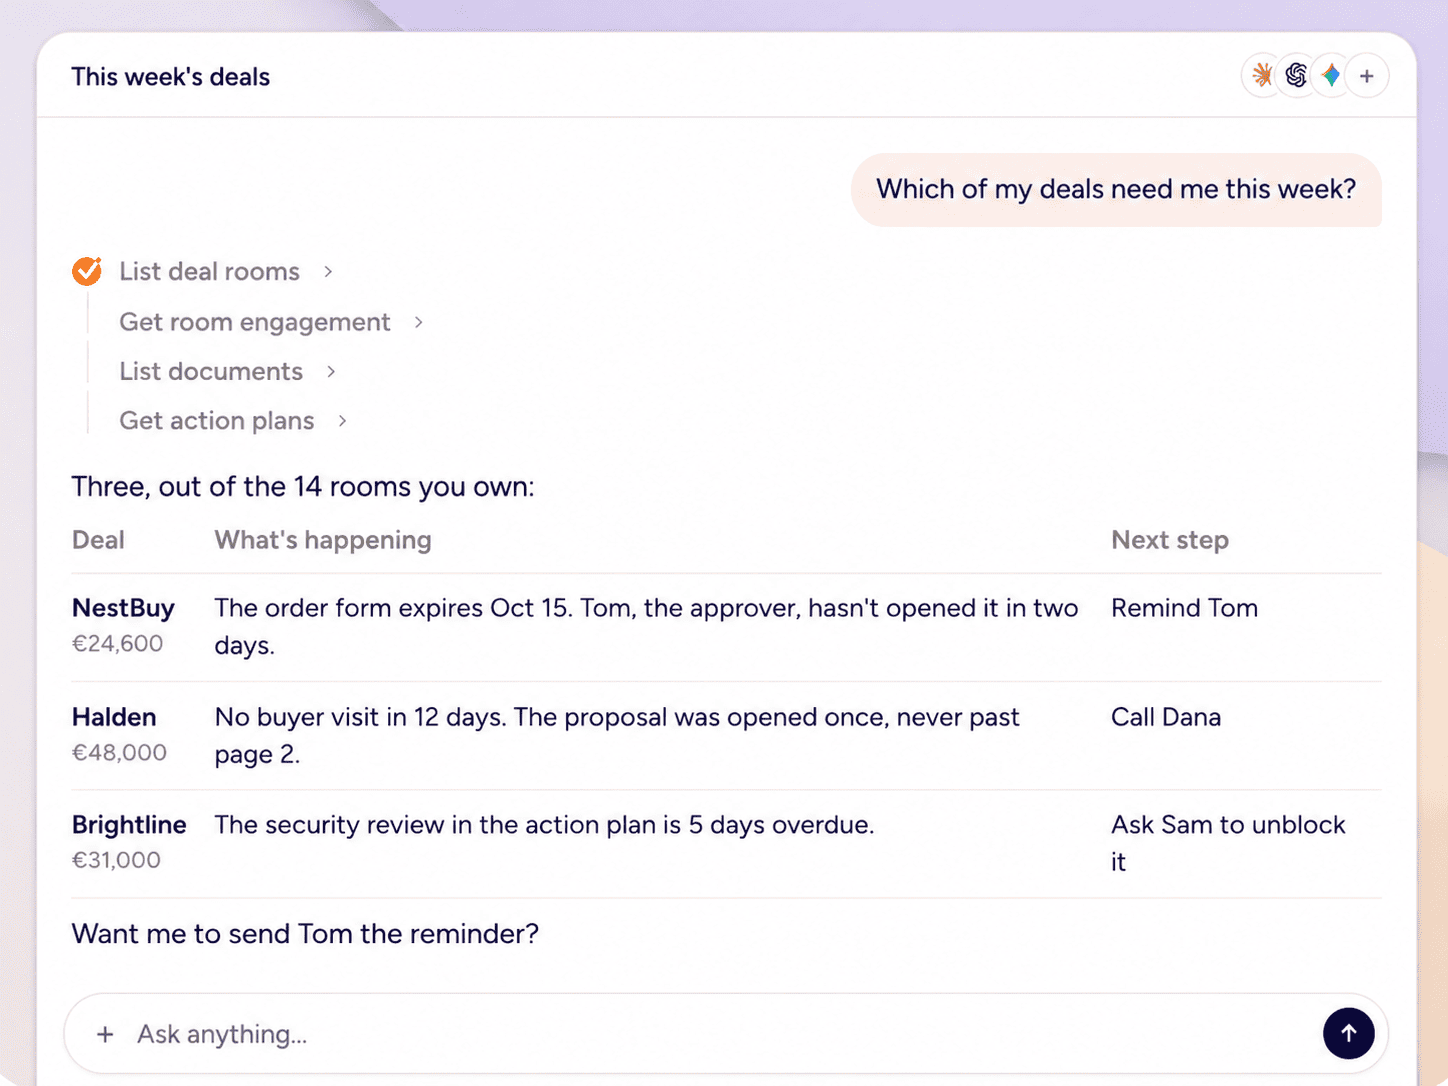 Then have the assistant turn the answers into an exception list for your call.
How it fits your stack
GetAccept syncs both ways with Salesforce, HubSpot, Microsoft Dynamics, Pipedrive and other CRMs. With event-based sync, all buyer actions in the room update CRM fields or stages automatically. So the evidence you inspect sits where your forecasting tool already reads.
Framework for combining CRM data and buyer engagement in your forecast review
You can run this workflow in your next weekly forecast review. It layers buyer evidence on top of your CRM baseline in seven steps so you can flag deals where the seller's story and the buyer's behavior don't match. Think of it as an exception queue, not a rebuild of your process.
|
Step |
What you do |
Question to ask |
|---|---|---|
|
1. CRM baseline |
Pull stage, amount, close date, category |
What does the seller say? |
|
2. Freshness check |
Flag stale fields and old updates |
When did this last change? |
|
3. Buyer-evidence inspection |
Review engagement in the Digital Sales Room |
Who engaged, and what did they view? |
|
4. Contradiction test |
Compare steps 1 and 3 |
Does the evidence support the stage and date? |
|
5. Forecast decision |
Keep, move or downgrade the category |
What's the rationale? |
|
6. Intervention |
Assign a coaching action |
What changes this week? |
|
7. Outcome capture |
Log what happened |
Was the signal useful? |
Run the review
Steps 1 and 2: baseline and freshness. Export commit and best case deals. Flag any with no field changes in 14 days. Your own thresholds beat anyone's universal cutoff.
Step 3: inspect buyer evidence. Look at breadth, seniority, recency, reciprocity and progression, not raw view counts. In a Digital Sales Room, that means checking who viewed pricing, who opened the contract, whether the proposal was shared internally and whether buyer-owned Mutual Action Plan tasks are moving.
In GetAccept: open the room's Analytics tab. Check First visits for breadth, the Participant Engagement Score for who's active and who's gone quiet, and the Action plan summary for buyer-owned progress. Then filter the Timeline by event type to find the last contract or action plan activity.
Step 4: test for contradictions. Build your exception queue from patterns like these:
-
A commit deal with one engaged stakeholder
-
A proposal sent but never opened
-
A close date inside two weeks with an overdue buyer task
-
A contract opened by legal and then silence
Consistency between digital and seller information was associated with 2.89x higher reported deal quality [Gartner, 2024]. That's correlational, so treat contradictions as questions for the rep.
In GetAccept: save a filtered view on the Rooms list (for example, rooms with a sent contract) and scan the participant activity column for anything stale. Or ask your AI assistant through the GetAccept MCP server: "Which of my deal rooms have a sent contract and no buyer visit in the last 14 days?"
Steps 5 to 7: decide, intervene, capture. Document why you moved a deal. Assign one action, like multi-threading to finance. Then log whether the deal closed or slipped.
If the problem is a deal that rests on one champion, our buyer enablement guide covers how to give the rest of the buying group what it needs to reach a decision.
How buyer signals can adjust probability and timing
Stage-based probabilities treat every deal in "Negotiation" the same. Buyer evidence lets you ask whether a given deal earns that number.
Say two deals sit at 60%. One has finance and legal active in the room, and a buyer-owned Mutual Action Plan task finished last week. The other has one champion who opened the proposal once, 18 days ago. You wouldn't forecast them the same way.
Use signals to prompt a manager's call, then back-test that call. The same goes for timing. A close date inside two weeks with no contract activity is a question for the rep.
Forecast review cadence and best practices for sales leaders and RevOps
Quick answer: Run the weekly review on the exception queue only, not on every deal. Use the monthly calibration to check false positives against what actually closed.
Pipeline forecasting needs an operating rhythm, shared definitions and clear ownership, not just more fields.
Here's the rhythm we'd run:
|
Cadence |
What happens |
Who owns it |
|---|---|---|
|
Daily |
Data refresh from CRM and Digital Sales Rooms |
RevOps |
|
Weekly |
Exception-based forecast review |
Frontline managers |
|
Monthly |
Calibration against actual outcomes |
CRO and RevOps |
Keep the weekly review to the exception queue from Step 4. Don't re-read every deal.
Shared standards keep the review honest:
-
Uniform stage and commit, best case and upside definitions, mapped to buyer-verified progress
-
Close-date hygiene rules
-
A visible change log
-
Documented rationale for every manager override
For the monthly calibration, compare signal-flagged deals against actual wins and slips, and review the false positives. Calibrate to your own data.
Ownership across the stack:
-
CRM: The system of record for stage, amount and close date. RevOps owns the definitions.
-
Digital Sales Room: The evidence layer, synced to the CRM.
-
Forecasting tool: The rollup, roll-forward and submission layer. Managers own the calls.
Gartner also found CSO-led analytics were 2.3x more likely to reach higher forecast accuracy [Gartner, 2024]. Leaders should own the standard.
Common mistakes when using engagement data in forecasting
Quick answer: The core mistake is reading engagement as intent. Even real buyer interest doesn’t guarantee action: intentions explain only about 28% of the variance in behavior.
Engagement data can sharpen your pipeline forecasting, but only if you read it with care:
-
Treating activity as intent. Intentions explain only about 28% of behavior, so even real interest doesn't guarantee action [Intention-behavior gap research, 2025]. A signal is consistent with momentum. It doesn't prove it.
-
Overweighting one signal. One proposal open means little. Look for a pattern across stakeholders.
-
Counting internal viewers or bot noise. Your own team's visits and link previews can inflate numbers.
-
Treating silence as disinterest. Buyers do a lot of work in channels you can't track. Separate "zero engagement" from "not observable."
How to get started with buyer engagement data in your forecast
Run one forecast review on your 5 to 10 biggest late-stage deals and flag every deal where the CRM story and buyer activity disagree. That list is your first exception queue.
Here's the four-step version:
-
Pick your deals. Choose the commit and best case deals that carry the most weight in your number.
-
Ask three questions per deal. Who on the buying side has engaged? Has anyone senior engaged? What changed in the last seven days?
-
Flag contradictions. A close date this month with one engaged stakeholder is a conversation, not a verdict.
-
Write down what you decide. Note which deals you moved and why, then check the outcomes at quarter end. That's your back-test.
If you already use GetAccept, run the four steps from the Rooms list. If you don't use GetAccept, run the same exercise with whatever buyer-side evidence you have today.